Example 12: Compare impact of frequency dependent \(D_{min}\)
[1]:
import itertools

import matplotlib.pyplot as plt
import numpy as np
import pandas as pd

import pystrata

%matplotlib inline
[2]:
plt.rcParams["figure.dpi"] = 150
Damping calculation
[3]:
plast_indices = [0, 20, 50, 100]
stresses_mean = 101.3 * np.array([0.5, 1, 2])
ocrs = [1, 2, 4]
freqs = np.logspace(-1, 2, num=31)

df = pd.DataFrame(
    itertools.product(freqs, stresses_mean, plast_indices, ocrs),
    columns=["freq", "stress_mean", "plast_ind", "ocr"],
)
[4]:
def calc_damp_min(row):
    return pystrata.site.DarendeliSoilType(
        plas_index=row.plast_ind,
        stress_mean=row.stress_mean,
        ocr=row.ocr,
        freq=row.freq,
    )._calc_damping_min()


df["damp_min"] = df.apply(calc_damp_min, axis=1)
[5]:
df.head()
[5]:
| freq | stress_mean | plast_ind | ocr | damp_min | |
|---|---|---|---|---|---|
| 0 | 0.1 | 50.65 | 0 | 1 | 0.003207 |
| 1 | 0.1 | 50.65 | 0 | 2 | 0.003207 |
| 2 | 0.1 | 50.65 | 0 | 4 | 0.003207 |
| 3 | 0.1 | 50.65 | 20 | 1 | 0.004240 |
| 4 | 0.1 | 50.65 | 20 | 2 | 0.004167 |
[6]:
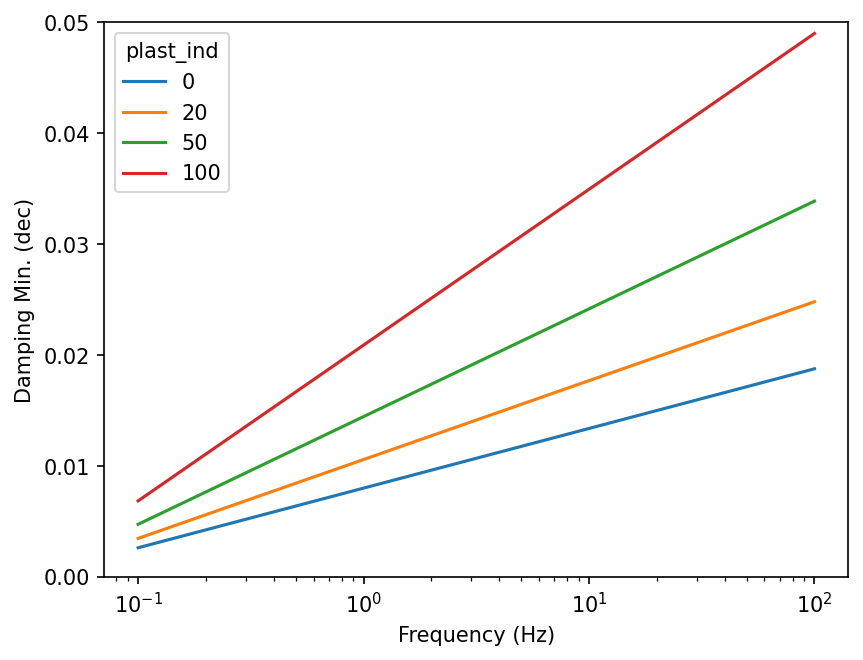
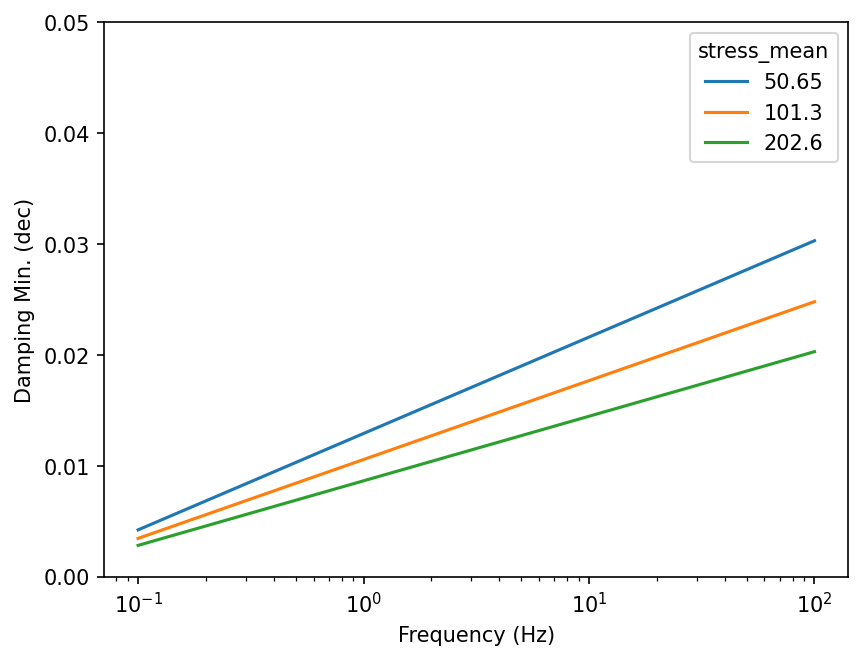
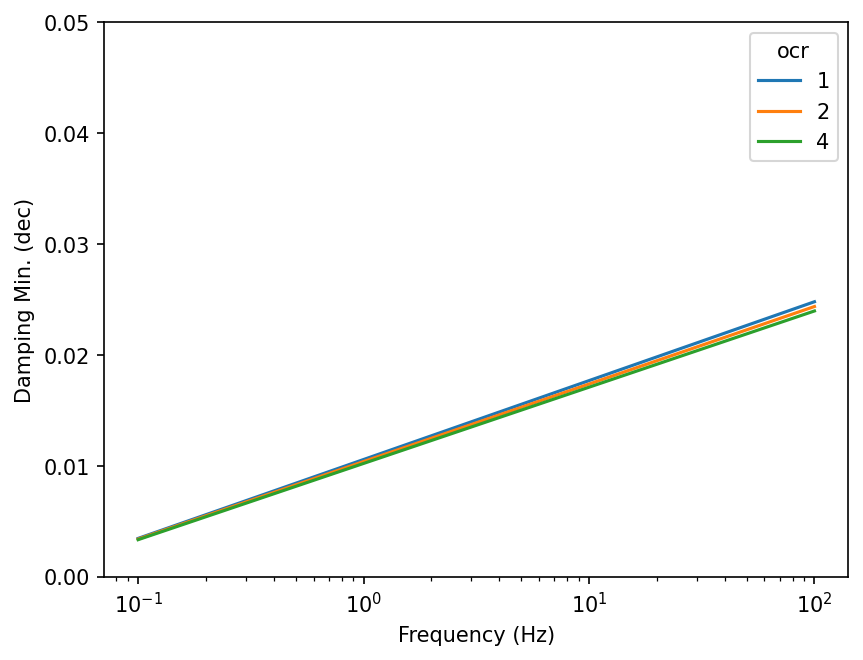
centers = {"plast_ind": 20, "stress_mean": 101.3, "ocr": 1}
[7]:
for key in centers:
    # Only select the centers
    mask = np.all([df[k].eq(v) for k, v in centers.items() if k != key], axis=0)
    selected = df[mask]

    fig, ax = plt.subplots()
    for name, group in selected.groupby(key):
        ax.plot(group["freq"], group["damp_min"], label=name)
    ax.set(
        xlabel="Frequency (Hz)",
        xscale="log",
        ylabel="Damping Min. (dec)",
        ylim=(0, 0.05),
    )
    ax.legend(title=key)
Site Response Calculation
Input
[8]:
motion = pystrata.motion.SourceTheoryRvtMotion(7.0, 30, "wna")
motion.calc_fourier_amps()
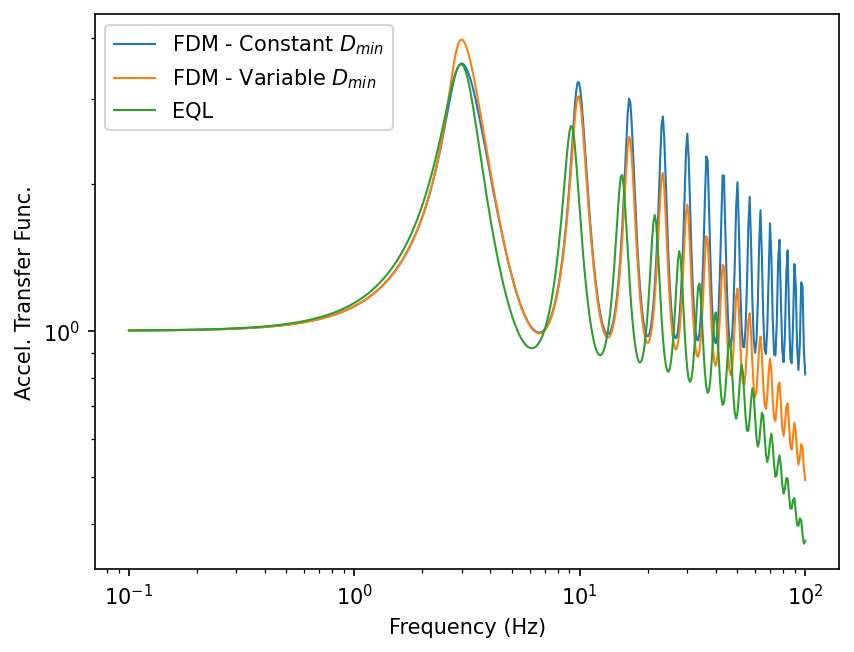
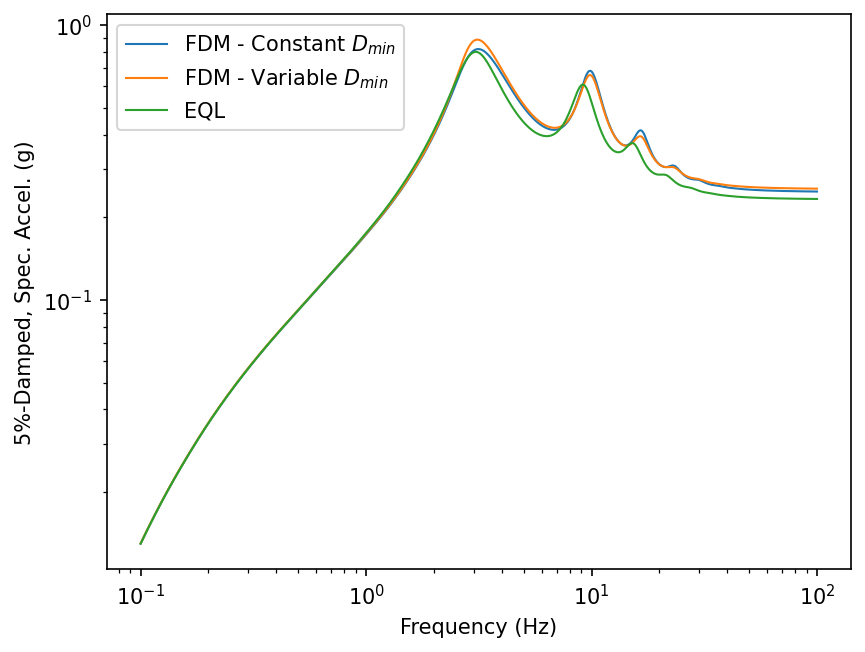
Two profiles are created. The first is a typical profile with the minimum damping computed at 1 Hz (default value). The second profile has the minimum damping computed at each frequency of the input motion.
[9]:
profiles = [
    # Frequency independent soil properties
    pystrata.site.Profile(
        [
            pystrata.site.Layer(
                pystrata.site.DarendeliSoilType(
                    18.0, plas_index=30, ocr=1, stress_mean=200
                ),
                30,
                400,
            ),
            pystrata.site.Layer(
                pystrata.site.SoilType("Rock", 24.0, None, 0.01), 0, 1200
            ),
        ]
    ),
    # Frequency dependent minimum damping
    pystrata.site.Profile(
        [
            pystrata.site.Layer(
                pystrata.site.DarendeliSoilType(
                    18.0, plas_index=30, ocr=1, stress_mean=200, freq=motion.freqs
                ),
                30,
                400,
            ),
            pystrata.site.Layer(
                pystrata.site.SoilType("Rock", 24.0, None, 0.01), 0, 1200
            ),
        ]
    ),
]

profiles = [p.auto_discretize() for p in profiles]
[10]:
calc_fdm = pystrata.propagation.FrequencyDependentEqlCalculator(method="raw")
calc_eql = pystrata.propagation.EquivalentLinearCalculator(strain_ratio=0.65)
[11]:
freqs = np.logspace(-1, 2, num=500)

outputs = pystrata.output.OutputCollection(
    [
        pystrata.output.AccelTransferFunctionOutput(
            # Frequency
            freqs,
            # Location in (denominator),
            pystrata.output.OutputLocation("outcrop", index=-1),
            # Location out (numerator)
            pystrata.output.OutputLocation("outcrop", index=0),
        ),
        pystrata.output.ResponseSpectrumOutput(
            # Frequency
            freqs,
            # Location of the output
            pystrata.output.OutputLocation("outcrop", index=0),
            # Damping
            0.05,
        ),
    ]
)
Run the analyses and save the output.
[12]:
for name, profile in zip(
    ["FDM - Constant $D_{min}$", "FDM - Variable $D_{min}$"], profiles
):
    calc_fdm(motion, profile, profile.location("outcrop", index=-1))
    outputs(calc_fdm, name)

calc_eql(motion, profiles[0], profiles[0].location("outcrop", index=-1))
outputs(calc_eql, "EQL")
Plot the results
[13]:
for o in outputs:
    o.plot(style="indiv")
[ ]: