Example 13: Impact of strain limit on EQL
Show the impact of the strain limit on the EQL calculation.
[1]:
import matplotlib.pyplot as plt
import numpy as np

import pystrata

%matplotlib inline
[2]:
# Increased figure sizes
plt.rcParams["figure.dpi"] = 120
Create the inputs
[3]:
ts = pystrata.motion.TimeSeriesMotion.load_at2_file("data/NIS090.AT2", scale=3)
ts.pga
[3]:
np.float64(1.508247)
[4]:
profile = pystrata.site.Profile(
    [
        pystrata.site.Layer(
            pystrata.site.DarendeliSoilType(
                18.0, plas_index=30, ocr=1, stress_mean=150
            ),
            15,
            150,
        ),
        pystrata.site.Layer(
            pystrata.site.DarendeliSoilType(20.0, plas_index=0, ocr=1, stress_mean=400),
            15,
            700,
        ),
        pystrata.site.Layer(pystrata.site.SoilType("Rock", 24.0, None, 0.01), 0, 1200),
    ]
).auto_discretize()
Create the calculators
[5]:
calcs = [
    pystrata.propagation.EquivalentLinearCalculator(strain_limit=sl)
    for sl in [0.01, 0.02, 0.05, 0.10]
]
[6]:
freqs = np.logspace(-1, 2, num=500)

outputs = pystrata.output.OutputCollection(
    [
        pystrata.output.ResponseSpectrumOutput(
            # Frequency
            freqs,
            # Location of the output
            pystrata.output.OutputLocation("outcrop", index=0),
            # Damping
            0.05,
        ),
        pystrata.output.ResponseSpectrumRatioOutput(
            # Frequency
            freqs,
            # Location in (denominator),
            pystrata.output.OutputLocation("outcrop", index=-1),
            # Location out (numerator)
            pystrata.output.OutputLocation("outcrop", index=0),
            # Damping
            0.05,
        ),
        pystrata.output.MaxStrainProfile(),
    ]
)
Perform calculation
[7]:
for c in calcs:
    try:
        c(ts, profile, profile.location("outcrop", index=-1))
    except RuntimeError as err:
        # Do something when the strain limit is exceeded?
        print(err)
        continue
    outputs(c, f"{c.strain_limit:0.2f}")
Strain limit exceeded.
Strain limit exceeded.
Plot the results
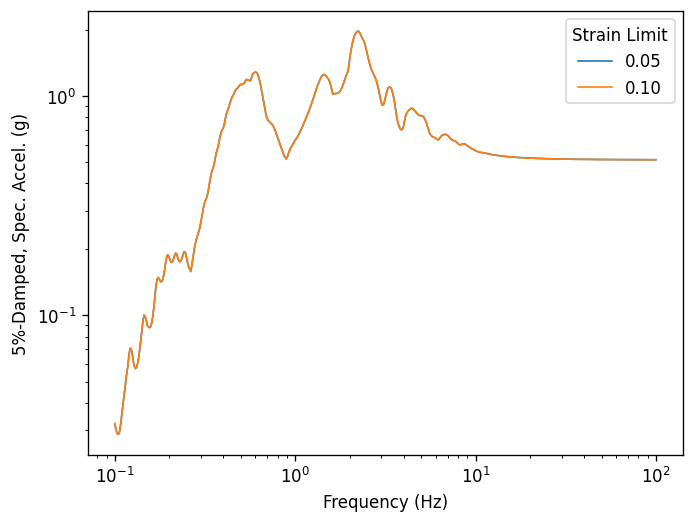
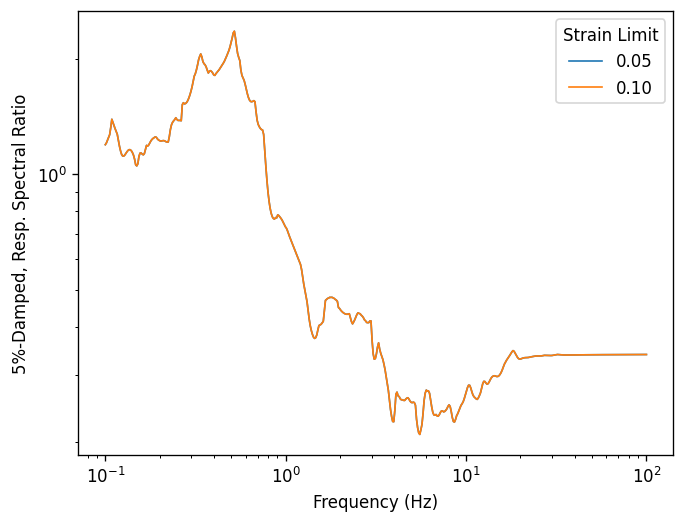
[8]:
for o in outputs[:2]:
    ax = o.plot(style="indiv")
    if ax.get_legend():
        ax.get_legend().set_title("Strain Limit")
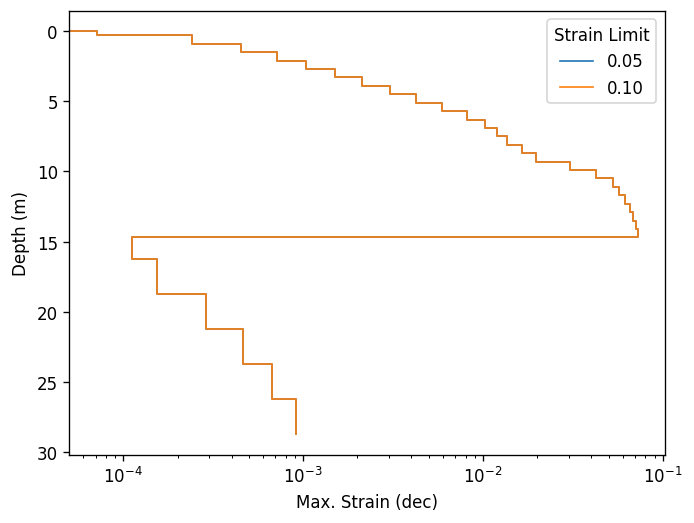
[9]:
for o in outputs[2:]:
    ax = o.plot(style="indiv")
    if ax.get_legend():
        ax.get_legend().set_title("Strain Limit")
[ ]: